(Go To: Top | General Summary | Monthly Report | Daily Summary | Hourly Summary | Domain Report | Organization Report | Browser Report | Browser Summary | Operating System Report | Status Code Report | File Size Report | File Type Report | Directory Report | Request Report)
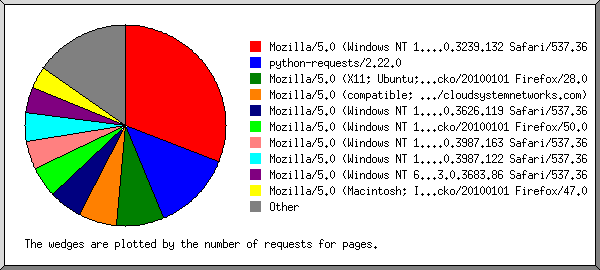
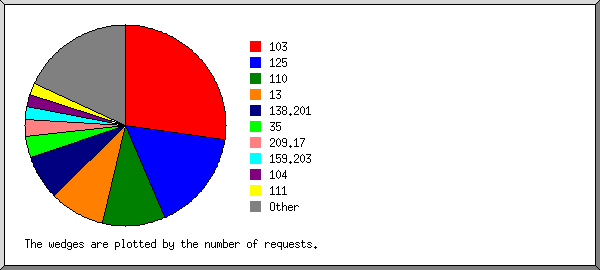
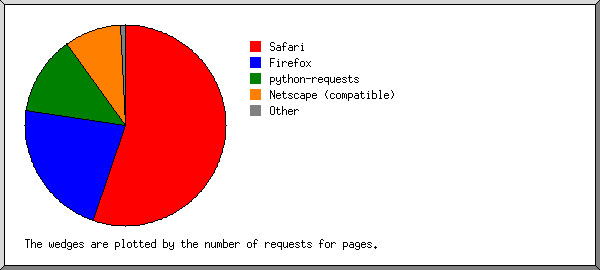
Listing browsers with at least 1 request for a page, sorted by the number of requests for pages.
| #reqs | #pages | browser |
|---|
| 458 | 458 | Mozilla/5.0 (Windows NT 10.0; Win64; x64) AppleWebKit/537.36 (KHTML, like Gecko) Chrome/63.0.3239.132 Safari/537.36 |
| 228 | 228 | python-requests/2.22.0 |
| 131 | 131 | Mozilla/5.0 (X11; Ubuntu; Linux i686; rv:28.0) Gecko/20100101 Firefox/28.0 |
| 95 | 95 | Mozilla/5.0 (Windows NT 10.0; Win64; x64) AppleWebKit/537.36 (KHTML, like Gecko) Chrome/72.0.3626.119 Safari/537.36 |
| 73 | 73 | Mozilla/5.0 (Windows NT 10.0; Win64; x64; rv:50.0) Gecko/20100101 Firefox/50.0 |
| 72 | 72 | Mozilla/5.0 (Windows NT 6.3; Win64; x64) AppleWebKit/537.36 (KHTML, like Gecko) Chrome/73.0.3683.86 Safari/537.36 |
| 42 | 42 | Mozilla/5.0 (Macintosh; Intel Mac OS X 10.11; rv:47.0) Gecko/20100101 Firefox/47.0 |
| 38 | 38 | Mozilla/5.0 (X11; Ubuntu; Linux x86_64; rv:58.0) Gecko/20100101 Firefox/58.0 |
| 38 | 38 | Mozilla/5.0 (Windows NT 10.0; Win64; x64; rv:64.0) Gecko/20100101 Firefox/64.0 |
| 38 | 38 | Mozilla/5.0 (Windows NT 10.0; Win64; x64) AppleWebKit/537.36 (KHTML, like Gecko) Chrome/74.0.3729.131 Safari/537.36 |
| 27 | 27 | Mozilla/5.0 (compatible; Nimbostratus-Bot/v1.3.2; http://cloudsystemnetworks.com) |
| 19 | 19 | Mozilla/5.0 (compatible; NetcraftSurveyAgent/1.0; +info@netcraft.com) |
| 4 | 4 | Mozilla/5.0 (Windows NT 10.0; Win64; x64) AppleWebKit/537.36 (KHTML, like Gecko) Chrome/76.0.3809.132 Safari/537.36 |
| 1 | 1 | Mozilla/5.0 (Windows NT 6.1; WOW64; rv:54.0) Gecko/20100101 Firefox/54.0 |
| 57 | 0 | [not listed: 1 browser] |
 Web Server Statistics for pelayanan.kecamatanbanyuwangi.net
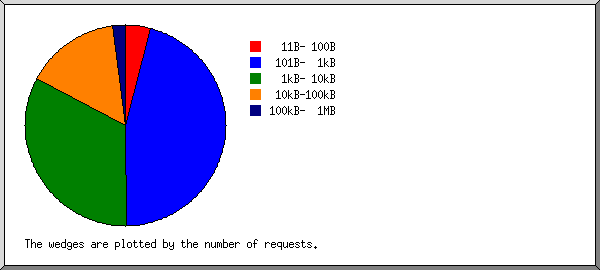
 ) represents 20 requests for pages or part thereof.